ECED3403 - Computer Architecture
Last updated
For active students, the class primarily uses Brightspace at https://dal.brightspace.com.
Material for my ECED3403 Computer Architecture class is available on the ECED3403 GitHub. This includes slides, assignments, etc. THIS MATERIAL MAY NOT BE ACCURATE FOR THE CURRENT ACADEMIC YEAR
What the course covers
ECED3403 answers one question from a few directions: how does a program actually run on a machine? It starts with C source code and follows it down through the compiler, the instruction set, interrupts, memory and caches, to the pipeline inside the CPU core, and it finishes with how you measure performance and power.
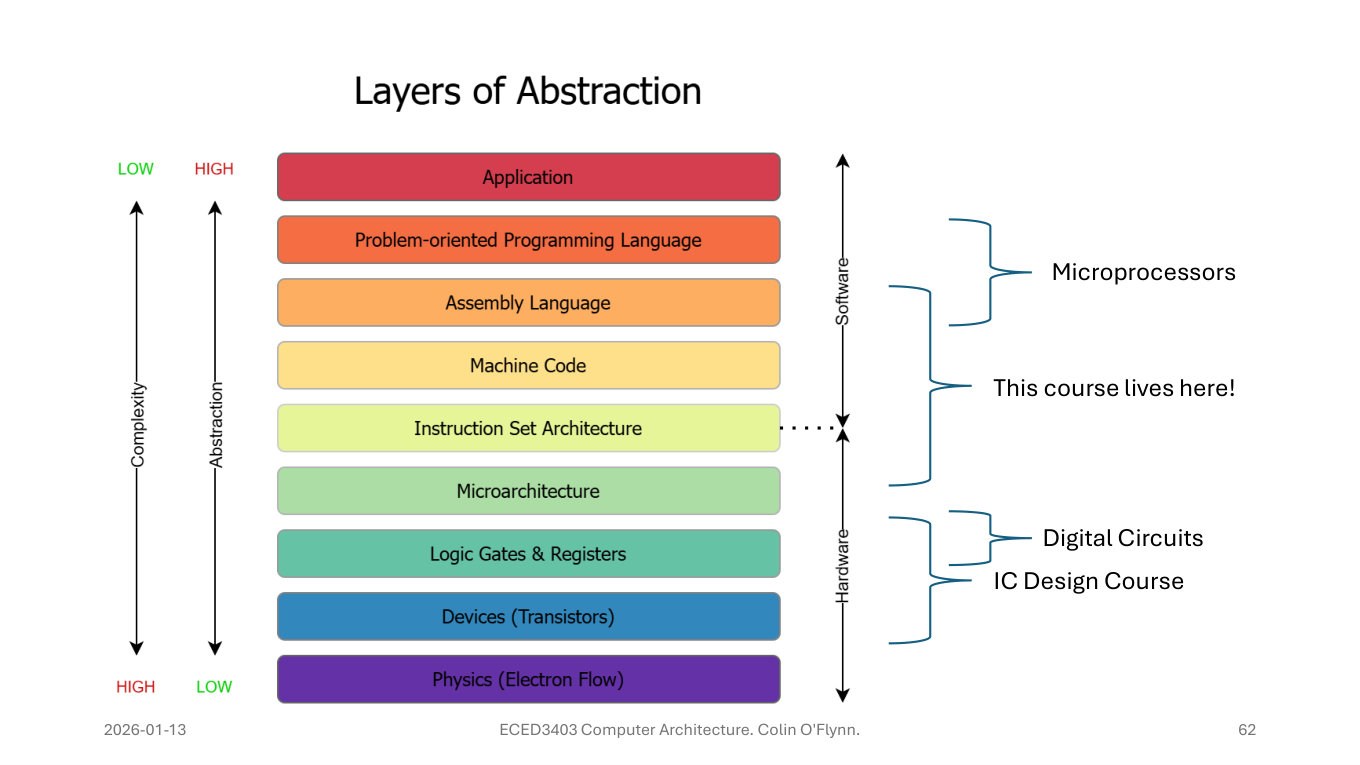
Where the course sits: from assembly language down to the microarchitecture, the layers between a microprocessors course and digital circuits.
It’s hands-on. The labs run on an STM32 Nucleo board (an STM32F303, Arm Cortex-M4) using SEGGER Embedded Studio and the Ozone debugger, so most topics end with seeing the effect on real hardware: stepping through optimized code, watching the stack on interrupt entry, timing DMA against the CPU, or triggering a fault on purpose.
Lectures
Slides are from the Winter 2026 offering. Each has a PDF (viewable on GitHub) and the original PowerPoint.
0. Introduction
- 0.0 Introduction: the course plan, evaluation, and the STM32 Nucleo board and Ozone debugger used in the labs. PDF · PPTX
1. From source code to running code
- 1.0 Layers: the layers of abstraction from application to physics. The same C function compiled for Arm, AVR, RISC-V, x86, MIPS, PowerPC and Z80 on Compiler Explorer; machine code, microarchitecture, RTL (the NEORV32 core), and how chips get made. PDF · PPTX
- 1.1 Compilers: preprocessor dangers, static analysis and linting, GCC vs. LLVM/Clang, intermediate representation, optimization and inlining, object files and libraries, linker scripts and memory segments, startup code, and ELF debug symbols. PDF · PPTX
- 1.2 Debuggers and Lab 1 Intro: on-chip debug (JTAG and SWD), debug symbols, code and data breakpoints, C vs. assembly stepping, and the side effects of debugging on watchdogs, interrupts, UARTs and USB. PDF · PPTX
2. The instruction set
- 2.0 ISA Introduction: building a simple 32-bit datapath one piece at a time, instruction encoding, CISC vs. RISC, register-memory vs. load-store, privilege levels, every addressing mode, and Arm ISA compatibility. PDF · PPTX
- 2.1 ISA ARM: the classic Arm instruction set: processor modes, registers, condition flags and conditional execution, the barrel shifter, multiplies, loads and stores, block transfers and stacks. PDF · PPT
- 2.2 Stack Frames (ISA and Compiler): calling conventions, how the stack grows, prologues and epilogues, caller- vs. callee-saved registers, stack traces and context switching. PDF · PPTX
- 2.3 Turing Completeness: what makes a machine a computer, from the Zuse Z3 and ENIAC
to one-instruction machines (FlipJump), x86’s
movalone being Turing complete, and computers built in PowerPoint and Excel. PDF · PPTX
3. Interrupts and exceptions
- 3.0 Interrupts and Exceptions: vector tables (AVR vs. Arm), the STM32F3’s NVIC,
handlers in C, interrupt context, main vs. process stack pointers, and what that odd
value in
LRmeans. PDF · PPTX - 3.1 Exceptions and Faults: race conditions and four ways to make operations atomic, interrupt priorities, nesting and tail-chaining, and Cortex-M faults: HardFault, memory, bus and usage faults, and reading the stack to find out what crashed. PDF · PPTX
4. Memory
- 4.0 Memory Introduction: addressing, von Neumann vs. Harvard, memory-mapped I/O, alignment, struct padding and packing, endianness, memory reordering and barriers. PDF · PPTX
- 4.1 Memory Busses: bus organizations, on-chip buses like AHB, the STM32F3 bus matrix, arbitration, DMA (with a demo), core-coupled memory, and external SRAM buses and wait states. PDF · PPTX
- 4.2 Memory Protection: ECC, Heartbleed, privilege and read/write/execute permissions, ASLR, MPUs vs. MMUs (with an STM32 MPU demo), memory-safe languages and Rust’s ownership model, and memory-safe hardware such as CHERIoT. PDF · PPTX
- 4.3 Memory Types: why tapes are still used in 2026, relay and core memory, SRAM and DRAM cells, PSRAM, EPROM, EEPROM and flash (floating gates, NOR vs. NAND, wear levelling), ROM and e-fuses. PDF · PPTX
- 4.4 Memory Caching: the memory wall, temporal and spatial locality, an i-j-k vs. i-k-j matrix multiply demo, average memory access time, direct-mapped and associative caches, write policies, and cache coherency problems on the STM32F7. PDF · PPTX
5. Inside the processor
- 5.0 Processor Core and ALU: the life of an instruction (fetch, decode, execute, memory, write-back), the register file, the ALU and its status flags, a comparison with the 50-year-old AM2901, microprogramming, and superscalar cores. PDF · PPTX
- 5.1 Pipeline: pipelining a small RISC-V program, hazards and stalls, branches and pipeline flushes, branch prediction, speculative and out-of-order execution, and how Cortex-M pipelines compare. PDF · PPTX
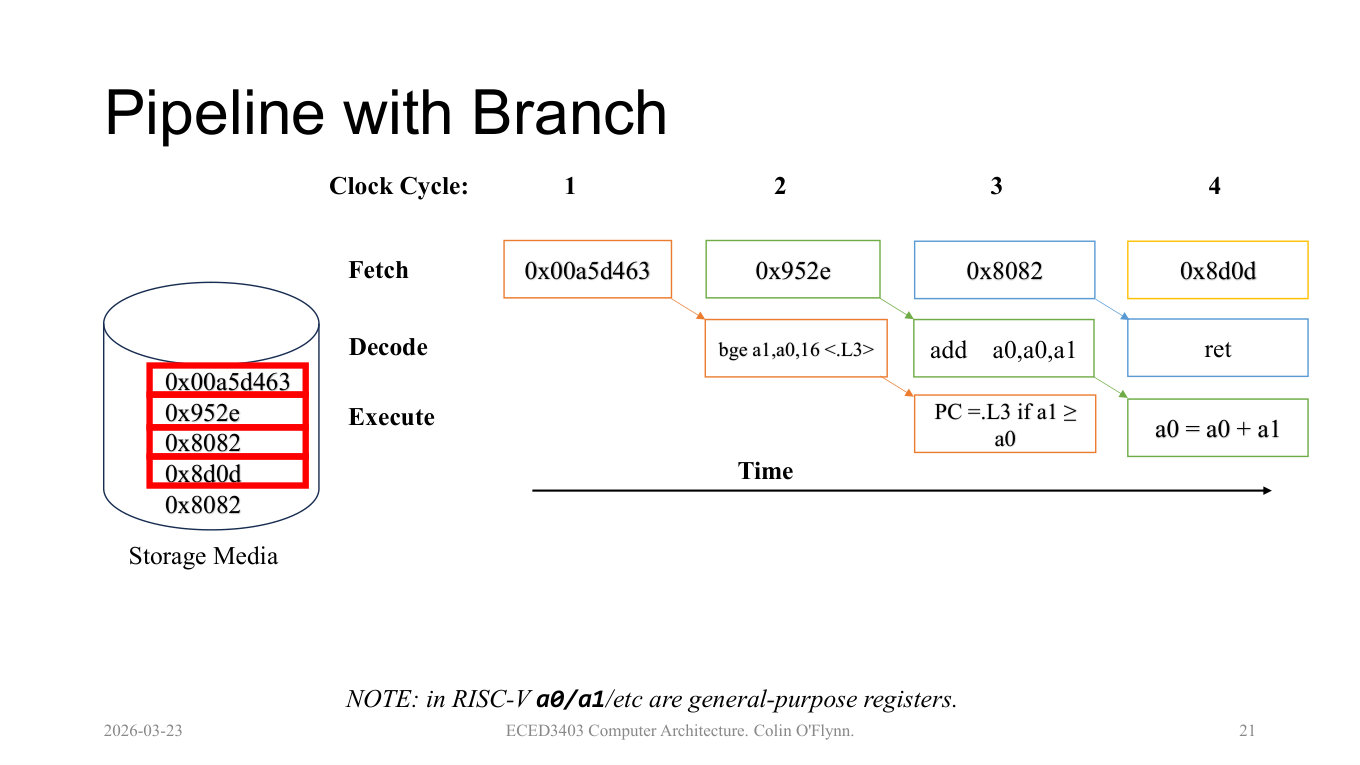
From 5.1: a branch working its way through a three-stage pipeline. The instructions fetched behind it are the problem: if the branch is taken, they have to be flushed.
- 5.2 Performance Measurement: clock speed vs. instructions per second, benchmarks such as CoreMark, counting cycles on embedded targets, dynamic power, coin-cell battery life, STM32F3 low-power modes, and common low-power mistakes. PDF · PPTX
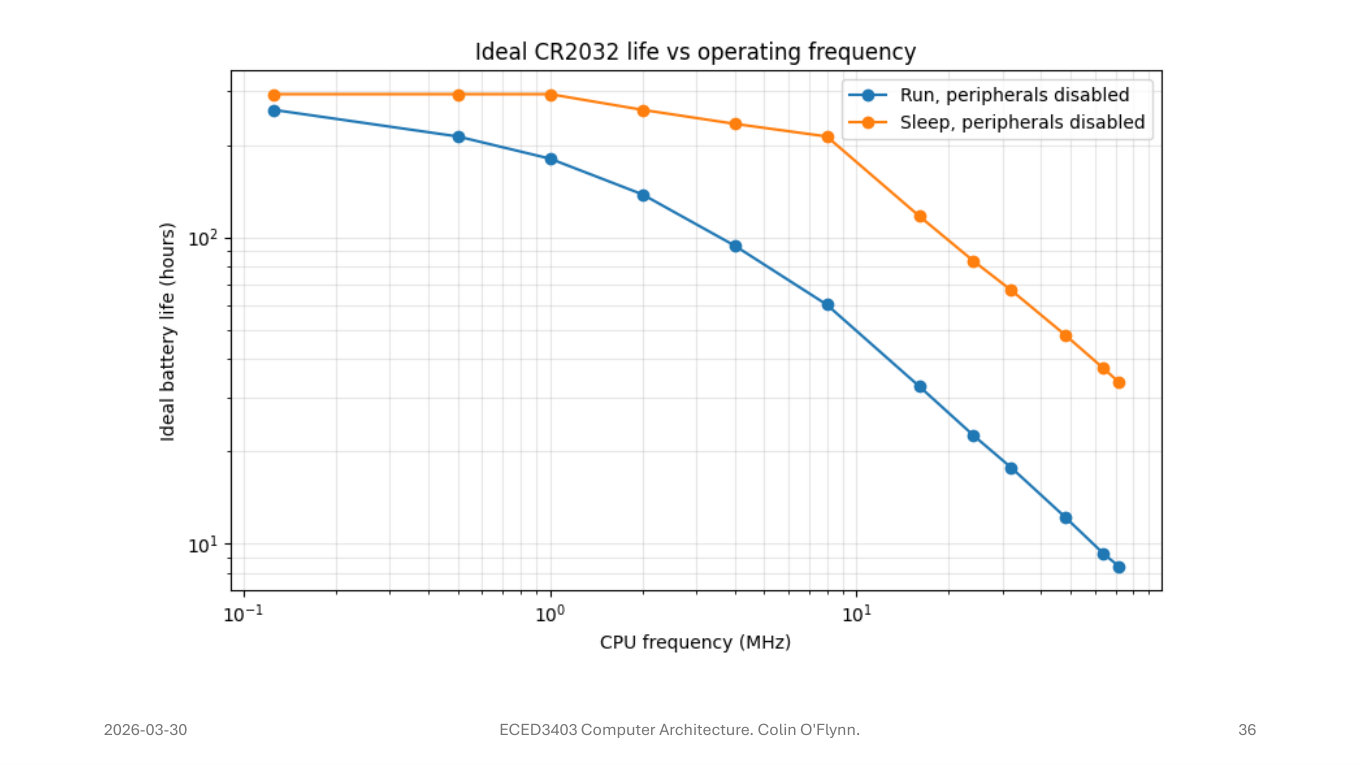
From 5.2: how long a CR2032 coin cell would ideally last at each CPU clock speed, running vs. sleeping, with peripherals off.
- 5.3 Funny Architectures, Rust, The End: VLIW and the SHARC DSP’s delay slots, Itanium, the i860, Transmeta’s Crusoe, the JVM, Intel’s iAPX 432 and Ada, then garbage collection vs. Rust’s ownership model, ending with blinking an LED in embedded Rust. PDF · PPTX
Labs
The labs run on the STM32F3 Nucleo board.
- Lab 1: Debugging: build and debug basics, exploring what the optimizer does to your code, then finding a real bug.
- Lab 2: Interrupts & Exceptions: writing an interrupt handler and inspecting the stack on entry, atomic operations, interrupt priorities, and debugging a hard fault.
- Lab 3: Memory & DMA: timing DMA copies against CPU copies across buffer sizes and optimization levels, then memory protection.
- Lab 4: ALU Operations and Pipeline Performance: checking the status flags 25 different instructions leave behind, then measuring pipelines and performance.
Assignments
- Assignment 1: “Predictable Preprocessor Ponderings”, what the C compiler emits, modifying machine code, and studying the stack and SRAM.
- Assignment 2: Circular Buffers: how circular buffers work (with FreeRTOS’s queue as the worked example), and making one safe against interrupts.
- Assignment 3: Memory: the memory types in real microcontrollers from their datasheets, average memory access time, and breaking an address down for a cache.
- Assignment 4: Pipelines: forwarding, pipeline depth and flush penalties, and memory latency, explored with a pipeline simulator written for the course.
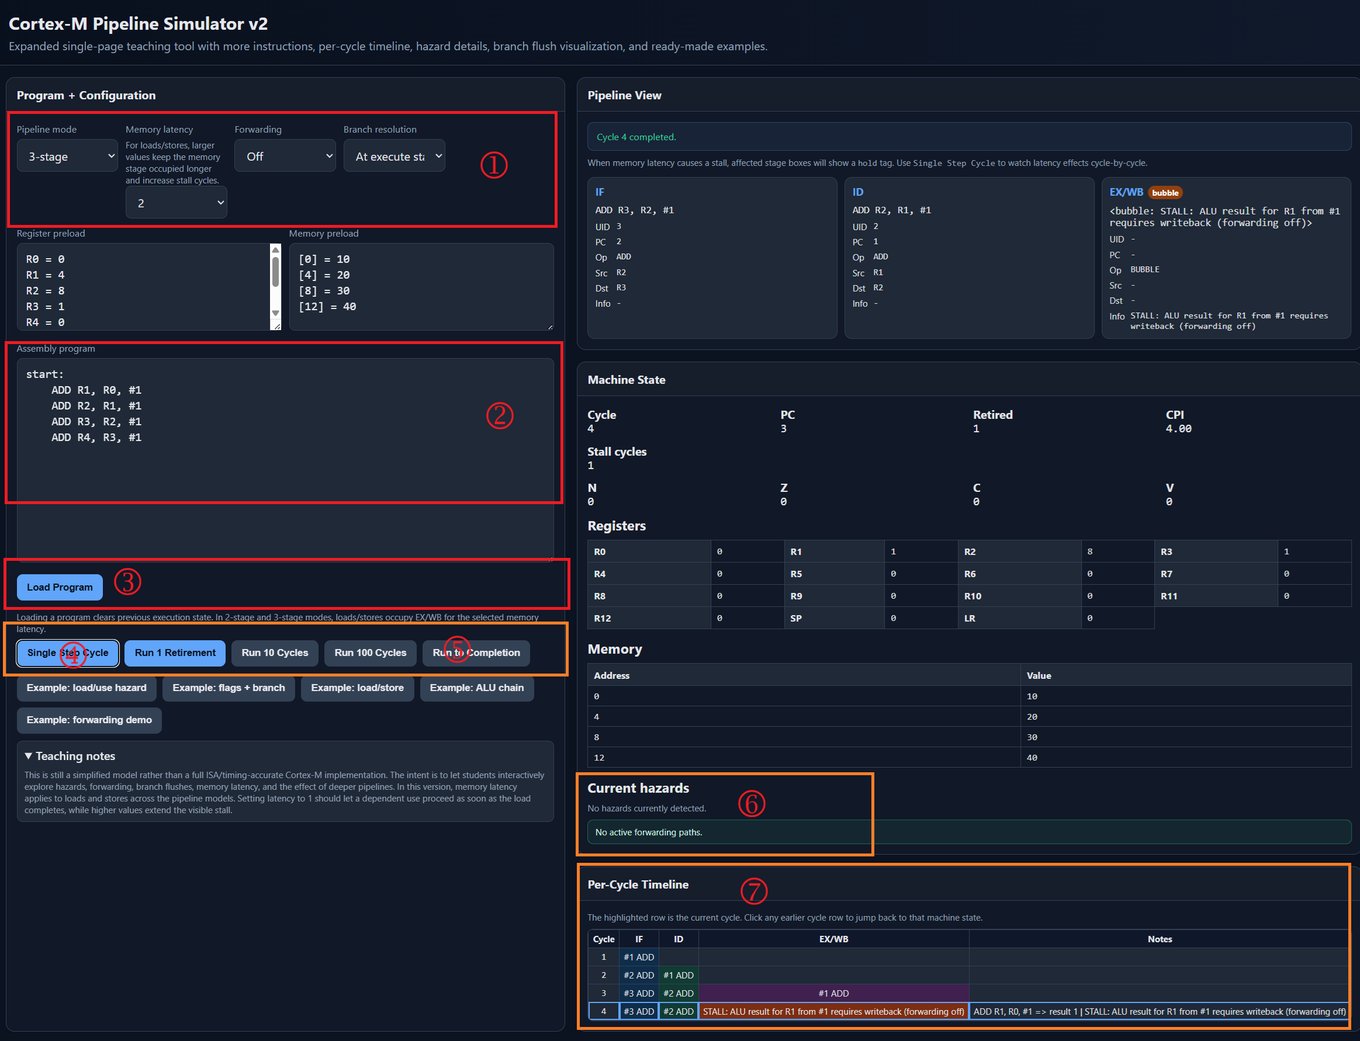
The pipeline simulator from Assignment 4, stalled on a data hazard with forwarding turned off. It’s a single HTML page: download it and open it in a browser.
Demo code and references
- Slide demo code: the code behind the live demos (faults, DMA, the MPU, memory speed, cache address breakdown), plus Rust examples.
- Cache simulator: the single-page tool used in the 4.4 caching lecture. Download it and open it in a browser.
- Arm Thumb instruction quick reference card.
Labs, assignments and similar material are CC-BY-SA. Some slides include images from other sources, which I don’t own; see the repository README.